Five Essential Canvases for Data Product Excellence
This toolkit includes five interconnected frameworks designed to guide your data product journey from conception to scaled deployment. Each canvas addresses a critical phase of the data product lifecycle, ensuring alignment between business strategy, technical execution, and measurable outcomes.
Data Product Use Case Template
Define business problems and align stakeholders around clear, measurable objectives
Data Product Canvas 2.1
Design comprehensive blueprints that map value, dependencies, and technical components
Data Product Value Measure Framework
Establish metrics to quantify impact, adoption, and ROI across the product lifecycle
Data Product Use Case Pipeline Management
Track and prioritize use cases from ideation through deployment at scale
Data Product Blueprint Model
Integrate governance, compliance, and lifecycle management for sustainable growth
Data Product Use Case Template
The Data Product Use Case Template serves as your starting point for transforming business challenges into actionable data product initiatives. This framework ensures that every data product begins with a clear understanding of the problem, the stakeholders involved, and the success criteria that will validate its impact.
By capturing essential elements upfront—including business context, data requirements, and expected outcomes—teams can align cross-functional stakeholders and secure buy-in before significant resources are invested. This template acts as a contract between business and technical teams, establishing shared expectations and accountability.
Business Problem Definition
Articulate the core challenge with precision, ensuring clarity on what needs to be solved and why it matters to the organization
Stakeholder Alignment
Identify key decision-makers, users, and influencers who will champion, use, or be impacted by the data product
Success Metrics
Define quantifiable KPIs that demonstrate value creation and enable data-driven decisions about product direction
Data Product Canvas 2.1
The Data Product Canvas 2.1 provides a comprehensive framework for designing data products with a user-centered approach. This canvas brings together business strategy, technical architecture, and governance requirements into a single, coherent view that guides product development from concept to deployment.
Unlike traditional project plans that focus solely on technical specifications, this canvas emphasizes the value proposition, user needs, and ecosystem dependencies. It enables product teams to think holistically about how data flows through the organization, who benefits from it, and what governance controls are necessary to ensure responsible use.
Value Proposition Mapping
Clearly articulate how the data product creates value for different customer segments and internal stakeholders
Data Asset Inventory
Identify inbound data flows, processing requirements, and output streams with clear ownership and quality standards
Governance Framework
Define privacy, security, legal, and ethical considerations that ensure compliance and build trust with users
Ecosystem Integration
Map key partners, dependencies, and integration points that enable the data product to deliver on its promise
Data Product Value Measure Framework
Quantifying the impact of data products requires a structured approach to measurement. The Data Product Value Measure Framework provides a systematic methodology for defining, tracking, and communicating the business value generated by data products throughout their lifecycle.
This framework goes beyond simple ROI calculations to capture the full spectrum of value—from operational efficiency gains and revenue growth to improved decision-making quality and enhanced customer experiences. By establishing clear metrics upfront and continuously monitoring them, organizations can make informed decisions about product investments and prioritization.
Define Value Objectives
Identify what success means for each stakeholder—revenue growth, efficiency, customer satisfaction, or strategic positioning
Select Key Metrics
Choose quantitative and qualitative measures that capture adoption, engagement, business outcomes, and user satisfaction
Analyze Trends
Leverage analytics and AI to continuously track performance, identify patterns, and uncover optimization opportunities
Refine & Iterate
Use feedback loops to enhance products based on real-world usage data and evolving business needs
Communicate Impact
Showcase value through compelling dashboards, reports, and case studies that resonate with stakeholders
Data Product Use Case Pipeline Management
Managing multiple data product use cases requires a systematic pipeline that ensures the right ideas are prioritized, validated, and executed efficiently. This framework provides a stage-gate approach that takes ideas from initial concept through proof of concept, MVP development, and full productization.
The pipeline management framework enables organizations to maintain a healthy portfolio of data products at various stages of maturity. By applying consistent evaluation criteria and governance checkpoints, teams can make objective decisions about which use cases deserve continued investment and which should be paused or deprioritized.
Ideation & Collection
Gather use cases from interviews, feedback channels, and analytics insights to build a comprehensive opportunity backlog
Classification & Prioritization
Evaluate ideas based on strategic fit, value potential, risk mitigation, and resource requirements using structured criteria
Value Experimentation
Develop proof of concept initiatives to validate assumptions, test technical feasibility, and demonstrate early value
MVP Development
Build minimum viable products with core functionality to gather real-world feedback and refine product-market fit
Productization & Scale
Transform validated MVPs into fully supported products with robust operations, documentation, and support structures
Data Product Blueprint Model
The Data Product Blueprint Model represents a holistic framework that integrates design, governance, and lifecycle management into a cohesive operating model for data products. This model addresses the full journey from data creation and curation through internal reuse and external monetization.
By establishing standardized practices across sourcing, cataloging, incubation, offering, and value realization, organizations can ensure consistency, compliance, and quality across their entire data product portfolio. The blueprint model also identifies critical transition points—the "data product chasms"—where many initiatives fail without proper governance and stakeholder alignment.
Data Sourcing & Creation
Establish processes for data acquisition, quality validation, and initial curation that meet governance standards
Catalog & Discovery
Enable discoverability through metadata management, data contracts, and self-service access controls
Internal Incubation
Develop use cases that demonstrate value within the organization before broader deployment
External Offering
Package data products for external consumption with appropriate commercialization and partnership models
Value Realization
Measure and optimize outcomes through continuous feedback loops, versioning, and product evolution
Template in Action: Data Product Use Case

The Data Product Use Case Template provides a practical structure for capturing all essential information needed to evaluate and prioritize data product opportunities. This example demonstrates how the template organizes information to facilitate quick decision-making and stakeholder alignment.
Core Components
Business Challenge
Describe the specific problem or opportunity with sufficient context for stakeholders to understand urgency and impact
Priority Classification
Apply a consistent framework: Must Test, Tempting, Nice to Have, or Cumbersome based on value vs. effort analysis
Stakeholder Map
Identify sponsors, users, technical owners, and influencers who will drive or be impacted by the solution
Success Criteria
Data Requirements
Specify source systems, data quality needs, update frequency, and any technical constraints or dependencies
Expected Outcomes
Define tangible results the data product should deliver, expressed in terms stakeholders care about
Impact Metrics
Establish KPIs that will be used to measure success and guide ongoing product optimization decisions
Canvas in Action: Data Product Canvas 2.1
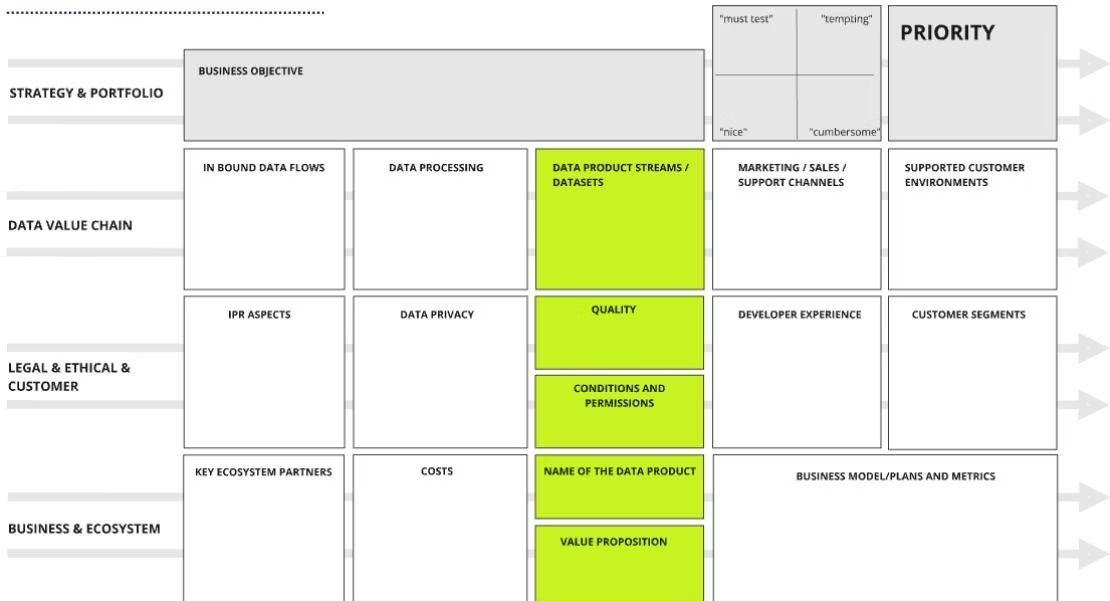
The Data Product Canvas 2.1 brings together all critical dimensions of data product design into a single, comprehensive view. This visual framework enables teams to see how strategy, technical architecture, business models, and governance requirements interconnect to create a viable data product.
"The canvas transforms abstract data concepts into concrete product strategies by forcing teams to think through value propositions, customer segments, data flows, and business models in an integrated way."
"The canvas transforms abstract data concepts into concrete product strategies by forcing teams to think through value propositions, customer segments, data flows, and business models in an integrated way."
Strategy & Portfolio Alignment
Links business objectives to data initiatives, ensuring products support organizational priorities and strategic goals
Value Chain Mapping
Visualizes how data flows from sources through processing to delivery channels, identifying dependencies and optimization opportunities
Governance Integration
Embeds privacy, quality, legal, and ethical considerations directly into the product design rather than treating them as afterthoughts
Business Model Definition
Clarifies how the data product creates and captures value, including pricing, cost structure, and ecosystem partnerships
Framework in Action: Measuring Data Product Value
The Data Product Value Measure Framework provides a five-stage methodology for quantifying and communicating the business impact of data products. This systematic approach ensures that value measurement becomes an ongoing discipline rather than a one-time exercise.
Define Value Objectives
The first step is to identify what success looks like for different stakeholders. Whether focused on revenue growth, operational efficiency, or improved customer experience, value must be defined in terms that resonate with decision-makers and justify continued investment.
Select Key Metrics
With objectives in place, the next step is choosing the right mix of quantitative and qualitative metrics. Numbers tell part of the story through adoption rates, usage patterns, and financial returns, but real value also manifests in user satisfaction, decision quality, and strategic capabilities enabled.
Collect Data & Analyze Trends
Once metrics are established, organizations leverage AI and analytics capabilities to continuously track how data products are performing. Patterns emerge over time, revealing optimization opportunities, usage trends, and areas where the product exceeds or falls short of expectations.
Refine Based on Feedback
Measuring value isn't a one-time exercise—it's an ongoing process of learning and adaptation. User feedback, both explicit and implicit through usage patterns, plays a critical role in refining and enhancing data products to better serve their intended purposes.
Communicate Value to Stakeholders
Finally, value must be effectively communicated to maintain stakeholder support and secure resources for continued development. Whether through executive dashboards, detailed reports, or compelling case studies, organizations need to showcase impact in ways that resonate with different audiences.
Pipeline in Action: Managing Use Case Flow
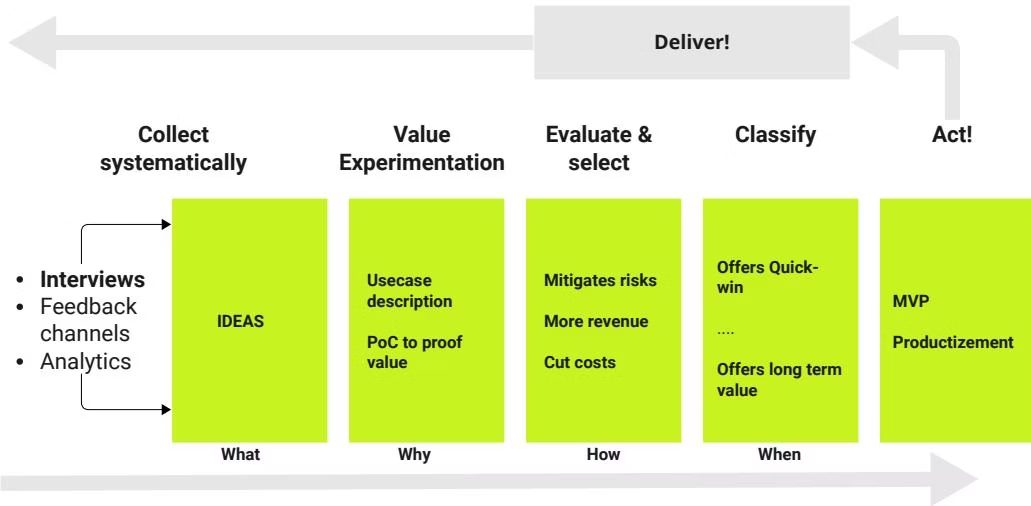
The Data Product Use Case Pipeline Framework provides a structured approach to managing the flow of ideas from initial concept through full productization. This systematic pipeline ensures that resources are invested in the right opportunities at the right time, with clear decision gates between stages.
Discovery Phase
- Collect ideas systematically from multiple channels including interviews, feedback systems, and analytics
- Classify opportunities using consistent criteria around value, risk, effort, and strategic alignment
- Build a healthy backlog that balances quick wins with long-term strategic investments
Validation Phase
- Evaluate selected use cases through proof of concept initiatives that test core assumptions
- Prove value with minimal investment before committing to full development
- Identify technical risks and dependencies early in the process
Execution Phase
- Develop MVPs that deliver core functionality to early adopters for feedback
- Productize successful MVPs with robust operations, documentation, and support
- Deliver value incrementally while building toward full-scale deployment
Blueprint in Action: End-to-End Data Product Lifecycle
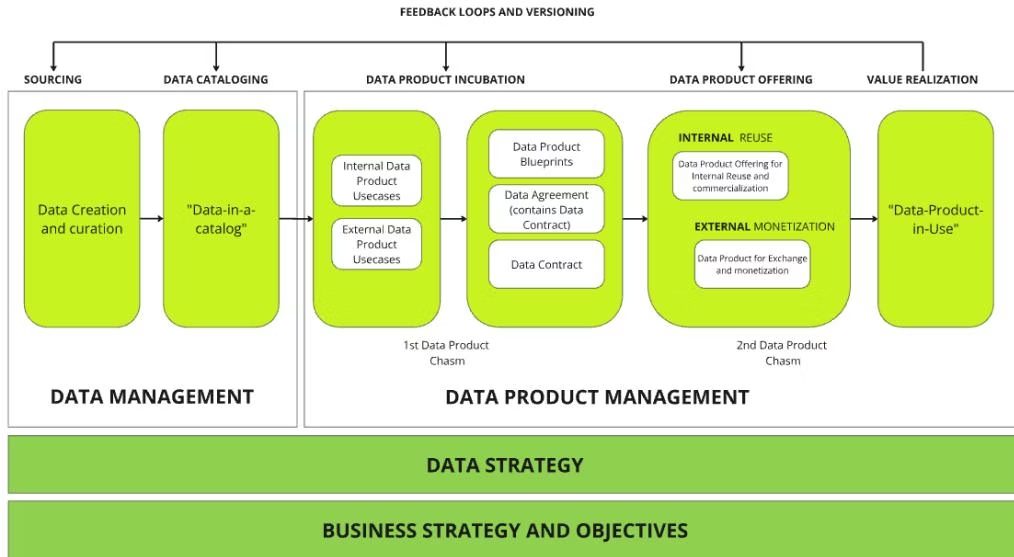
The Data Product Blueprint Model illustrates the complete journey from raw data sourcing through value realization, highlighting two critical transition points where many data initiatives fail without proper governance and stakeholder alignment.
Sourcing & Cataloging
Data creation, curation, and organization into discoverable catalogs with clear ownership and quality standards
First Data Product Chasm
Critical transition from raw data to useful internal products—many initiatives stall here without clear use cases and business sponsorship
Internal Incubation
Development of internal use cases that prove value, establish patterns, and build organizational capability
Second Data Product Chasm
Challenging leap from internal use to external monetization—requires robust governance, legal frameworks, and go-to-market capabilities
External Offering & Realization
Packaging data products for exchange or commercialization with continuous feedback loops driving improvement
Key Insight: The two data product chasms represent natural friction points where organizations must invest in governance, change management, and capability building to successfully scale data products beyond initial prototypes.
Putting It All Together: The Complete Workflow
As a data product steward, your role is to bridge strategy and execution, ensuring that data products deliver measurable business value. The Data Product Toolkit provides an integrated workflow that spans from initial concept through scaled deployment, with each canvas supporting specific phases of the journey.
Phase 1: Define
Use Case Template → Canvas 2.1
Phase 2: Validate
Value Framework → Pipeline Management
Phase 3: Scale
Blueprint Model → Continuous Improvement
Define the Data Product
Start with the Data Product Use Case Template to identify problems worth solving and engage business stakeholders early
Define expected outcomes and impact metrics such as revenue increase, cost savings, or efficiency gains
Use the Data Product Canvas 2.1 to structure value propositions, target users, technical requirements, and dependencies
Align with data teams on technical feasibility and set monetization models if applicable
Validate, Measure & Iterate
Apply the Value Measure Framework to define success metrics for adoption, engagement, and ROI
Set up feedback loops to measure real-world impact and validate assumptions
Use Pipeline Management to track the journey from PoC through MVP to full deployment
Prioritize use cases based on value impact versus effort, continuously adjusting the roadmap based on data-driven insights
Scale & Govern the Data Product
Implement the Data Product Blueprint Model to ensure compliance, security, and interoperability as the product scales. Standardize best practices across multiple products and teams, enable continuous delivery through automated testing and CI/CD pipelines, and drive a culture of experimentation and rapid iteration.
"Success in data product management requires both a product mindset that focuses on user value and an agile mindset that enables rapid iteration based on real-world feedback. The Data Product Toolkit provides the structured frameworks needed to balance both."
"Success in data product management requires both a product mindset that focuses on user value and an agile mindset that enables rapid iteration based on real-world feedback. The Data Product Toolkit provides the structured frameworks needed to balance both."